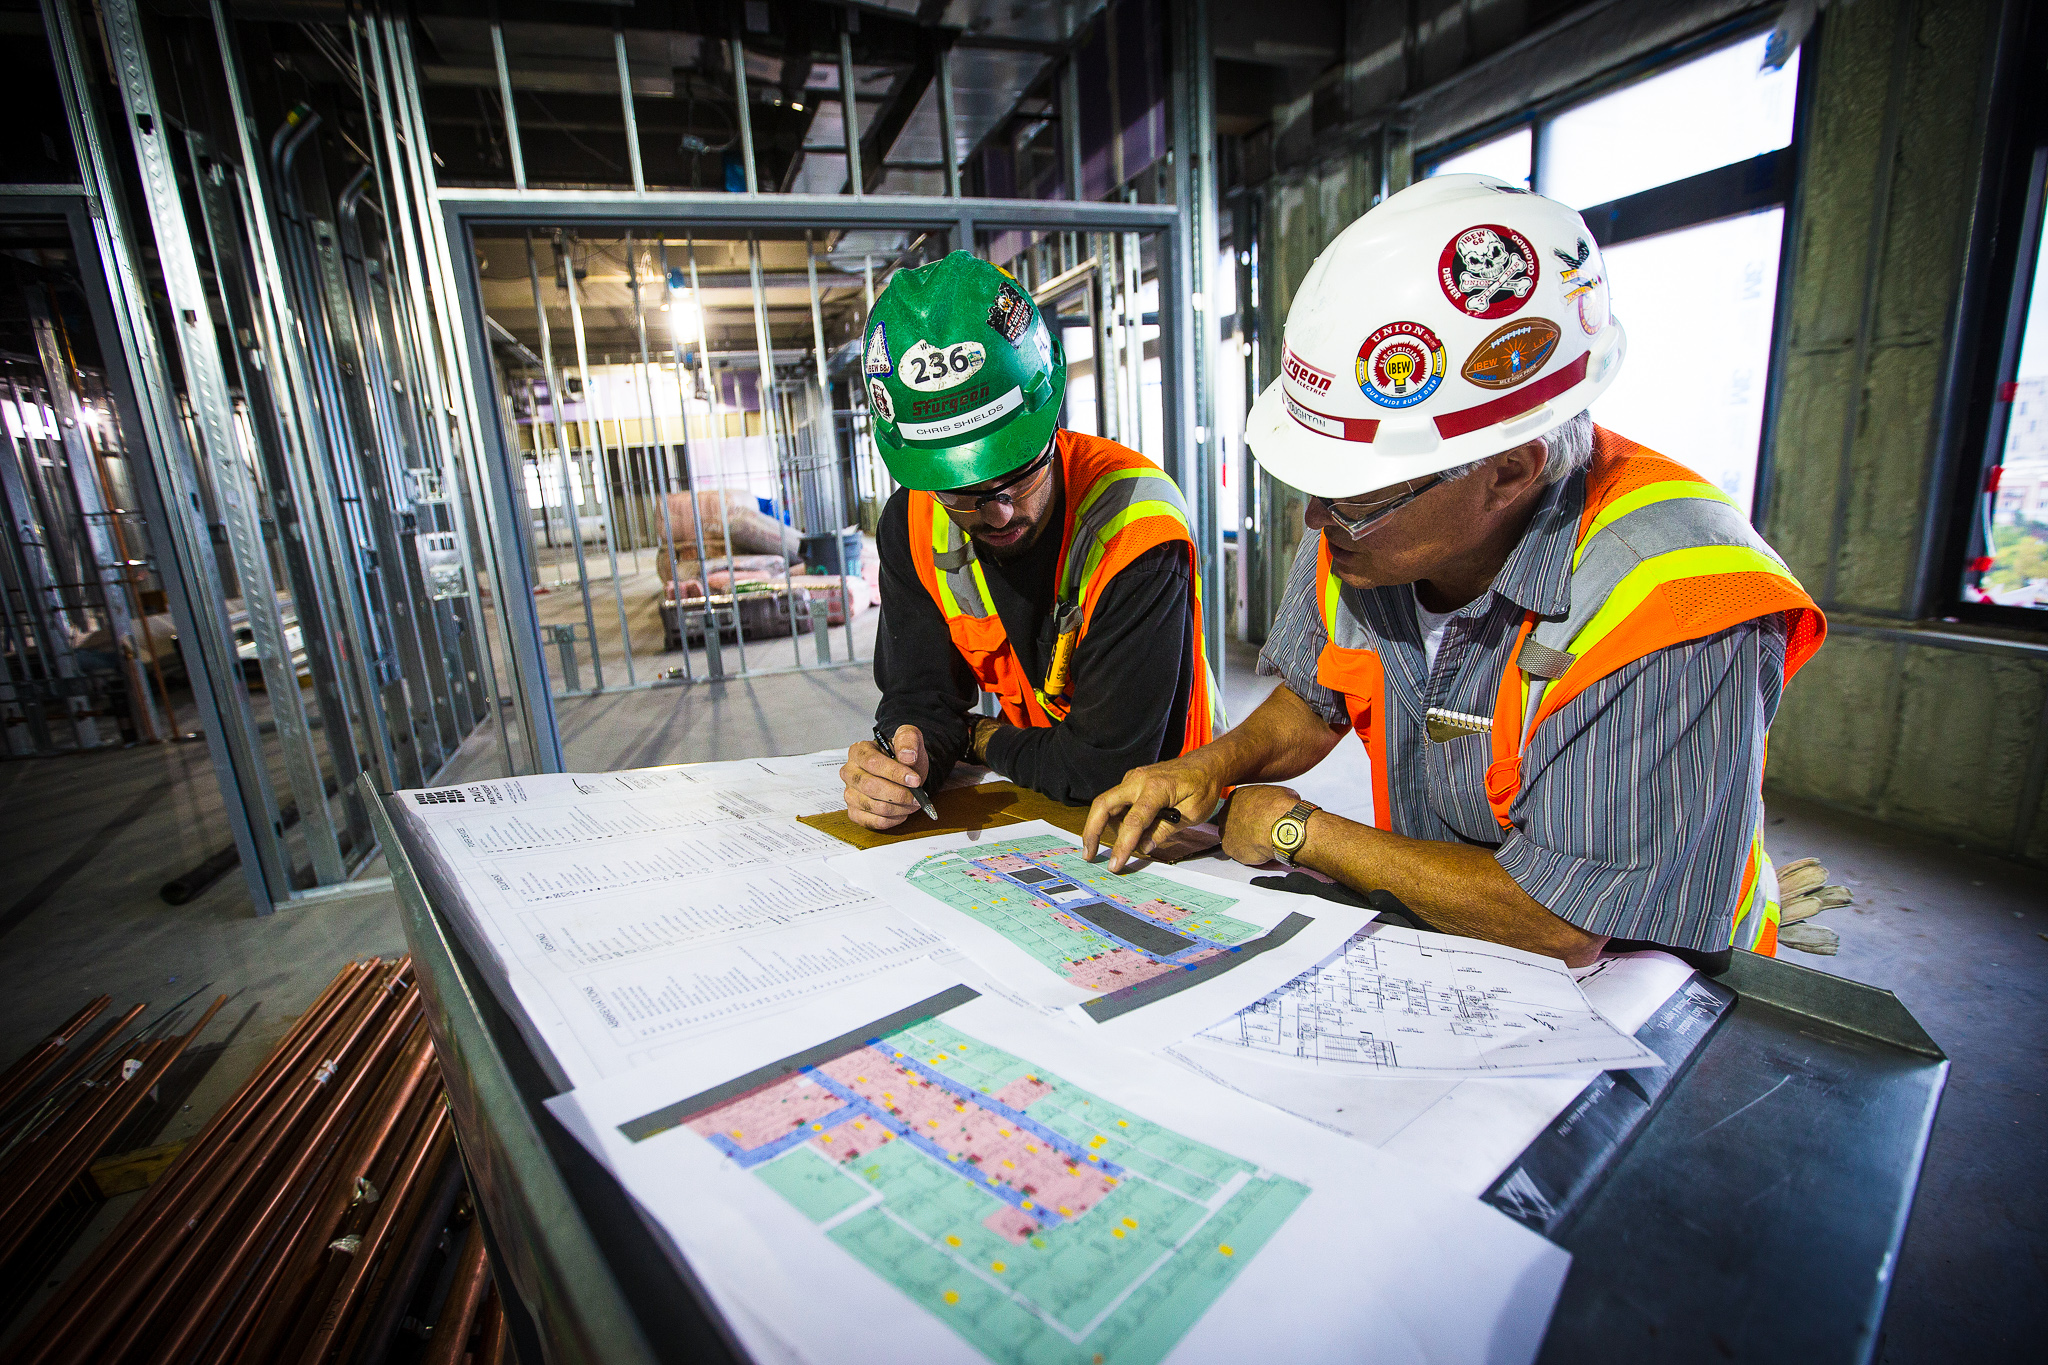
MYR Group Inc. Announces Third-Quarter and First Nine-Months 2026 Results - Board Approves New $100 Million Share Repurchase Program
Highlights for Third Quarter 2026
- Record quarterly revenues of
$1.26 billion - Record quarterly net income of
$60.0 million , or$3.82 per diluted share - Record quarterly EBITDA of
$110.0 million - Record backlog of
$3.68 billion
Management Comments
Third Quarter Results
MYR reported third-quarter 2026 revenues of
Consolidated gross profit increased to
Selling, general and administrative (“SG&A”) expenses increased to
Amortization of intangible assets increased to
Interest expense increased to
Income tax expense was
For the third quarter of 2026, net income was
First Nine-Months Results
MYR reported first nine-months 2026 revenues of
Consolidated gross profit increased to
SG&A expenses increased to
Amortization of intangible assets increased to
Interest income increased to
Interest expense increased to
Income tax expense was
For the first nine months of 2026, net income was
Backlog
As of
Balance Sheet
As of
Share Repurchase Program
In addition, the Company announced today that its Board of Directors approved a new share repurchase program (the “Repurchase Program”), which will be effective on
Non-GAAP Financial Measures
To supplement MYR’s financial statements presented in accordance with generally accepted accounting principles in
MYR believes that these non-GAAP measures are useful because they (i) provide both management and investors meaningful supplemental information regarding financial performance by excluding certain expenses and benefits that may not be indicative of recurring core business operating results, (ii) permit investors to view MYR’s performance using the same tools that management uses to evaluate MYR’s past performance, reportable business segments and prospects for future performance, (iii) publicly disclose results that are relevant to financial covenants included in MYR’s credit facility and (iv) otherwise provide supplemental information that may be useful to investors in evaluating MYR.
Conference Call
MYR will host a conference call to discuss its third-quarter 2026 results on
About
Forward-Looking Statements
Various statements in this announcement, including those that express a belief, expectation, or intention, as well as those that are not statements of historical fact, are forward-looking statements. The forward-looking statements may include projections and estimates concerning the timing and success of specific projects and our future production, revenue, income, capital spending, segment improvements and investments. Forward-looking statements are generally accompanied by words such as “anticipate,” “believe,” “estimate,” “expect,” “intend,” “likely,” “may,” “objective,” “outlook,” “plan,” “project,” “possible,” “potential,” “should,” “unlikely,” or other words that convey the uncertainty of future events or outcomes. The forward-looking statements in this announcement speak only as of the date of this announcement. We disclaim any obligation to update these statements (unless required by securities laws), and we caution you not to rely on them unduly. We have based these forward-looking statements on our current expectations and assumptions about future events. While our management considers these expectations and assumptions to be reasonable, they are inherently subject to significant business, economic, competitive, regulatory and other risks, contingencies and uncertainties, most of which are difficult to predict and many of which are beyond our control. No forward-looking statement can be guaranteed and actual results may differ materially from those projected. Forward-looking statements in this announcement should be evaluated together with the many uncertainties that affect MYR's business, particularly those mentioned in the risk factors and cautionary statements in Item 1A. of MYR's Annual Report on Form 10-K for the fiscal year ended
Financial tables follow…
Consolidated Balance Sheets As of |
|||||||
| (in thousands, except share and per share data) | 2026 |
2025 |
|||||
| (unaudited) | |||||||
| ASSETS | |||||||
| Current assets: | |||||||
| Cash and cash equivalents | $ | 26,010 | $ | 150,156 | |||
| Accounts receivable, net of allowances of |
799,461 | 603,735 | |||||
| Contract assets, net of allowances of |
318,367 | 241,766 | |||||
| Current portion of receivable for insurance claims in excess of deductibles | 7,861 | 10,122 | |||||
| Refundable income taxes | 4,873 | — | |||||
| Prepaid expenses and other current assets | 30,615 | 54,982 | |||||
| Total current assets | 1,187,187 | 1,060,761 | |||||
| Property and equipment, net of accumulated depreciation of |
345,614 | 306,386 | |||||
| Operating lease right-of-use assets | 63,304 | 42,448 | |||||
| 224,045 | 115,266 | ||||||
| Intangible assets, net of accumulated amortization of |
230,855 | 72,476 | |||||
| Receivable for insurance claims in excess of deductibles | 22,719 | 21,358 | |||||
| Deferred income taxes | 18,264 | 12,723 | |||||
| Investment in joint ventures | 3,258 | 3,224 | |||||
| Other assets | 12,300 | 9,437 | |||||
| Total assets | $ | 2,107,546 | $ | 1,644,079 | |||
| LIABILITIES AND SHAREHOLDERS' EQUITY | |||||||
| Current liabilities: | |||||||
| Current portion of long-term debt | $ | 16,988 | $ | 4,554 | |||
| Current portion of operating lease obligations | 14,572 | 13,019 | |||||
| Current portion of finance lease obligations | 1,064 | 804 | |||||
| Accounts payable | 385,259 | 314,789 | |||||
| Contract liabilities, net | 280,540 | 300,560 | |||||
| Current portion of accrued self-insurance | 29,935 | 28,499 | |||||
| Accrued income taxes | 129 | 15,129 | |||||
| Other current liabilities | 160,910 | 117,923 | |||||
| Total current liabilities | 889,397 | 795,277 | |||||
| Deferred income tax liabilities | 95,473 | 50,119 | |||||
| Long-term debt | 198,782 | 54,483 | |||||
| Accrued self-insurance | 43,838 | 42,827 | |||||
| Operating lease obligations, net of current maturities | 48,359 | 29,429 | |||||
| Finance lease obligations, net of current maturities | 1,348 | 1,220 | |||||
| Other liabilities | 11,364 | 10,301 | |||||
| Total liabilities | 1,288,561 | 983,656 | |||||
| Commitments and contingencies | |||||||
| Shareholders’ equity: | |||||||
| Preferred stock—$0.01 par value per share; 4,000,000 authorized shares; none issued and outstanding at |
— | — | |||||
| Common stock—$0.01 par value per share; 100,000,000 authorized shares; 15,570,008 and 15,522,834 shares issued and outstanding at |
155 | 155 | |||||
| Additional paid-in capital | 170,292 | 165,211 | |||||
| Accumulated other comprehensive loss | (11,071 | ) | (8,183 | ) | |||
| Retained earnings | 659,609 | 503,240 | |||||
| Total shareholders’ equity | 818,985 | 660,423 | |||||
| Total liabilities and shareholders’ equity | $ | 2,107,546 | $ | 1,644,079 | |||
Unaudited Consolidated Statements of Operations
Three and Nine Months Ended
| Three months ended |
Nine months ended |
||||||||||||||
| (in thousands, except per share data) | 2026 | 2025 | 2026 | 2025 | |||||||||||
| Contract revenues | $ | 1,259,032 | $ | 950,400 | $ | 3,341,139 | $ | 2,684,345 | |||||||
| Contract costs | 1,087,791 | 838,508 | 2,892,785 | 2,371,841 | |||||||||||
| Gross profit | 171,241 | 111,892 | 448,354 | 312,504 | |||||||||||
| Selling, general and administrative expenses | 81,517 | 65,919 | 225,349 | 191,756 | |||||||||||
| Amortization of intangible assets | 6,087 | 1,214 | 8,514 | 3,613 | |||||||||||
| Gain on sale of property and equipment | (1,469 | ) | (1,512 | ) | (3,282 | ) | (3,213 | ) | |||||||
| Income from operations | 85,106 | 46,271 | 217,773 | 120,348 | |||||||||||
| Other income (expense): | |||||||||||||||
| Interest income | 292 | 197 | 2,068 | 433 | |||||||||||
| Interest expense | (3,580 | ) | (1,440 | ) | (4,945 | ) | (4,759 | ) | |||||||
| Other income (expense), net | 517 | (297 | ) | (1,405 | ) | (1,130 | ) | ||||||||
| Income before provision for income taxes | 82,335 | 44,731 | 213,491 | 114,892 | |||||||||||
| Income tax expense | 22,330 | 12,637 | 56,835 | 33,024 | |||||||||||
| Net income | $ | 60,005 | $ | 32,094 | $ | 156,656 | $ | 81,868 | |||||||
| Income per common share: | |||||||||||||||
| —Basic | $ | 3.85 | $ | 2.07 | $ | 10.06 | $ | 5.22 | |||||||
| —Diluted | $ | 3.82 | $ | 2.05 | $ | 9.97 | $ | 5.20 | |||||||
| Weighted average number of common shares and potential common shares outstanding: | |||||||||||||||
| —Basic | 15,579 | 15,528 | 15,565 | 15,681 | |||||||||||
| —Diluted | 15,721 | 15,631 | 15,715 | 15,752 | |||||||||||
Unaudited Consolidated Statements of Cash Flows Nine Months Ended |
|||||||
| Nine months ended |
|||||||
| (in thousands) | 2026 | 2025 | |||||
| Cash flows from operating activities: | |||||||
| Net income | $ | 156,656 | $ | 81,868 | |||
| Adjustments to reconcile net income to net cash flows provided by operating activities: | |||||||
| Depreciation and amortization of property and equipment | 51,622 | 45,664 | |||||
| Amortization of intangible assets | 8,514 | 3,613 | |||||
| Stock-based compensation expense | 13,395 | 9,808 | |||||
| Deferred income taxes | 2,380 | 3,312 | |||||
| Gain on sale of property and equipment | (3,282 | ) | (3,213 | ) | |||
| Other non-cash items | 586 | 345 | |||||
| Changes in operating assets and liabilities, net of acquisition: | |||||||
| Accounts receivable, net | (93,939 | ) | 53,714 | ||||
| Contract assets, net | (21,461 | ) | (38,538 | ) | |||
| Receivable for insurance claims in excess of deductibles | 900 | (511 | ) | ||||
| Other assets | 18,069 | 14,241 | |||||
| Accounts payable | 33,756 | 4,795 | |||||
| Contract liabilities, net | (54,796 | ) | (31,113 | ) | |||
| Accrued self-insurance | 2,457 | 2,845 | |||||
| Other liabilities | 19,298 | 64,907 | |||||
| Net cash flows provided by operating activities | 134,155 | 211,737 | |||||
| Cash flows from investing activities: | |||||||
| Proceeds from sale of property and equipment | 4,019 | 6,014 | |||||
| Cash paid for acquired business | (324,788 | ) | — | ||||
| Purchases of property and equipment | (81,974 | ) | (64,467 | ) | |||
| Net cash flows used in investing activities | (402,743 | ) | (58,453 | ) | |||
| Cash flows from financing activities: | |||||||
| Borrowings under revolving lines of credit | 786,645 | 635,003 | |||||
| Repayments under revolving lines of credit | (824,059 | ) | (633,048 | ) | |||
| Borrowing under term loans | 199,287 | — | |||||
| Payment of principal obligations under equipment notes | (4,596 | ) | (4,360 | ) | |||
| Payment of principal obligations under finance leases | (668 | ) | (844 | ) | |||
| Repurchase of common stock | (1,307 | ) | (75,000 | ) | |||
| Debt refinancing costs | (3,634 | ) | — | ||||
| Payments related to tax withholding for stock-based compensation | (7,294 | ) | (2,653 | ) | |||
| Other financing activities | 254 | — | |||||
| Net cash flows provided by (used in) financing activities | 144,628 | (80,902 | ) | ||||
| Effect of exchange rate changes on cash | (186 | ) | 365 | ||||
| Net increase (decrease) in cash and cash equivalents | (124,146 | ) | 72,747 | ||||
| Cash and cash equivalents: | |||||||
| Beginning of period | 150,156 | 3,464 | |||||
| End of period | $ | 26,010 | $ | 76,211 | |||
Unaudited Consolidated Selected Data,
Unaudited Performance Measure and Reconciliation of Non-GAAP Measure
For the Three, Nine and Twelve Months Ended
As of
| Three months ended |
Last twelve months ended |
|||||||||||||||||
| (dollars in thousands, except share and per share data) | 2026 | 2025 | 2026 | 2025 | ||||||||||||||
| Summary Statement of Operations Data: | ||||||||||||||||||
| Contract revenues | $ | 1,259,032 | $ | 950,400 | $ | 4,314,683 | $ | 3,514,140 | ||||||||||
| Gross profit | $ | 171,241 | $ | 111,892 | $ | 559,636 | $ | 398,449 | ||||||||||
| Income from operations | $ | 85,106 | $ | 46,271 | $ | 264,297 | $ | 150,505 | ||||||||||
| Income before provision for income taxes | $ | 82,335 | $ | 44,731 | $ | 259,883 | $ | 141,896 | ||||||||||
| Income tax expense | $ | 22,330 | $ | 12,637 | $ | 66,679 | $ | 44,076 | ||||||||||
| Net income | $ | 60,005 | $ | 32,094 | $ | 193,204 | $ | 97,820 | ||||||||||
| Tax rate | 27.1 | % | 28.3 | % | 25.7 | % | 31.1 | % | ||||||||||
| Per Share Data: | ||||||||||||||||||
| Income per common share: | ||||||||||||||||||
| - Basic | $ | 3.85 | $ | 2.07 | $ | 12.41 | (1 | ) | $ | 6.22 | (1 | ) | ||||||
| - Diluted | $ | 3.82 | $ | 2.05 | $ | 12.31 | (1 | ) | $ | 6.19 | (1 | ) | ||||||
| Weighted average number of common shares and potential common shares outstanding: | ||||||||||||||||||
| - Basic | 15,579 | 15,528 | 15,556 | (2 | ) | 15,794 | (2 | ) | ||||||||||
| - Diluted | 15,721 | 15,631 | 15,696 | (2 | ) | 15,862 | (2 | ) | ||||||||||
| (in thousands) | 2026 |
2025 |
2025 |
2024 |
|||||||
| Summary Balance Sheet Data: | |||||||||||
| Total assets | $ | 2,107,546 | $ | 1,644,079 | $ | 1,548,853 | $ | 1,512,331 | |||
| Total shareholders’ equity | $ | 818,985 | $ | 660,423 | $ | 617,588 | $ | 588,509 | |||
| $ | 454,900 | $ | 187,742 | $ | 187,704 | $ | 195,047 | ||||
| Total funded debt (3) | $ | 215,770 | $ | 59,037 | $ | 71,976 | $ | 93,186 | |||
| Three months ended |
Nine months ended |
||||||||||||||||||||||||||
| (dollars in thousands) | 2026 | 2025 | 2026 | 2025 | |||||||||||||||||||||||
| Segment Results: | Amount | Percent | Amount | Percent | Amount | Percent | Amount | Percent | |||||||||||||||||||
| Contract revenues: | |||||||||||||||||||||||||||
| Transmission & Distribution | $ | 554,544 | 44.0 | % | $ | 503,436 | 53.0 | % | $ | 1,619,536 | 48.5 | % | $ | 1,471,479 | 54.8 | % | |||||||||||
| Commercial & Industrial | 704,488 | 56.0 | 446,964 | 47.0 | 1,721,603 | 51.5 | 1,212,866 | 45.2 | |||||||||||||||||||
| Total | $ | 1,259,032 | 100.0 | % | $ | 950,400 | 100.0 | % | $ | 3,341,139 | 100.0 | % | $ | 2,684,345 | 100.0 | % | |||||||||||
| Operating income: | |||||||||||||||||||||||||||
| Transmission & Distribution | $ | 51,634 | 9.3 | % | $ | 41,461 | 8.2 | % | $ | 153,357 | 9.5 | % | $ | 118,147 | 8.0 | % | |||||||||||
| Commercial & Industrial | 61,616 | 8.7 | 28,583 | 6.4 | 146,109 | 8.5 | 67,953 | 5.6 | |||||||||||||||||||
| Total | 113,250 | 9.0 | 70,044 | 7.4 | 299,466 | 8.9 | 186,100 | 6.9 | |||||||||||||||||||
| Corporate | (28,144 | ) | (2.2 | ) | (23,773 | ) | (2.5 | ) | (81,693 | ) | (2.4 | ) | (65,752 | ) | (2.4 | ) | |||||||||||
| Consolidated | $ | 85,106 | 6.8 | % | $ | 46,271 | 4.9 | % | $ | 217,773 | 6.5 | % | $ | 120,348 | 4.5 | % | |||||||||||
See notes at the end of this earnings release
Unaudited Performance Measures and Reconciliation of Non-GAAP Measures Three and Twelve Months Ended |
|||||||||||||||
| Three months ended |
Last twelve months ended |
||||||||||||||
| (in thousands, except share, per share data, ratios and percentages) | 2026 | 2025 | 2026 | 2025 | |||||||||||
| Financial Performance Measures (4): | |||||||||||||||
| EBITDA (5) | $ | 109,988 | $ | 62,713 | $ | 340,730 | $ | 213,986 | |||||||
| EBITDA per Diluted Share (6) | $ | 7.00 | $ | 4.01 | $ | 21.71 | $ | 13.51 | |||||||
| EBIA, net of taxes (7) | $ | 66,839 | $ | 33,856 | $ | 203,008 | $ | 105,562 | |||||||
| Free Cash Flow (8) | $ | 9,155 | $ | 65,412 | $ | 137,106 | $ | 156,085 | |||||||
| Book Value per Period End Share (9) | $ | 52.12 | $ | 39.52 | |||||||||||
| Tangible Book Value (10) | $ | 364,085 | $ | 429,884 | |||||||||||
| Tangible Book Value per Period End Share (11) | $ | 23.17 | $ | 27.51 | |||||||||||
| Funded Debt to Equity Ratio (12) | 0.26 | 0.12 | |||||||||||||
| Asset Turnover (13) | 2.79 | 2.32 | |||||||||||||
| Return on Assets (14) | 12.5 | % | 6.5 | % | |||||||||||
| Return on Equity (15) | 31.3 | % | 16.6 | % | |||||||||||
| Return on |
25.0 | % | 16.4 | % | |||||||||||
| Reconciliation of Non-GAAP Measures: | |||||||||||||||
| Reconciliation of Net Income to EBITDA: | |||||||||||||||
| Net income | $ | 60,005 | $ | 32,094 | $ | 193,204 | $ | 97,820 | |||||||
| Interest expense, net | 3,288 | 1,243 | 3,476 | 6,421 | |||||||||||
| Income tax expense | 22,330 | 12,637 | 66,679 | 44,076 | |||||||||||
| Depreciation and amortization | 24,365 | 16,739 | 77,371 | 65,669 | |||||||||||
| EBITDA (5) | $ | 109,988 | $ | 62,713 | $ | 340,730 | $ | 213,986 | |||||||
| Reconciliation of Net Income per Diluted Share to EBITDA per Diluted Share: | |||||||||||||||
| Net income per share | $ | 3.82 | $ | 2.05 | $ | 12.31 | $ | 6.19 | |||||||
| Interest expense, net, per share | 0.21 | 0.08 | 0.22 | 0.40 | |||||||||||
| Income tax expense per share | 1.42 | 0.81 | 4.25 | 2.78 | |||||||||||
| Depreciation and amortization per share | 1.55 | 1.07 | 4.93 | 4.14 | |||||||||||
| EBITDA per Diluted Share (6) | $ | 7.00 | $ | 4.01 | $ | 21.71 | $ | 13.51 | |||||||
| Reconciliation of Non-GAAP measure: | |||||||||||||||
| Net income | $ | 60,005 | $ | 32,094 | $ | 193,204 | $ | 97,820 | |||||||
| Interest expense, net | 3,288 | 1,243 | 3,476 | 6,421 | |||||||||||
| Amortization of intangible assets | 6,087 | 1,214 | 9,719 | 4,816 | |||||||||||
| Tax impact of interest and amortization of intangible assets | (2,541 | ) | (695 | ) | (3,391 | ) | (3,495 | ) | |||||||
| EBIA, net of taxes (7) | $ | 66,839 | $ | 33,856 | $ | 203,008 | $ | 105,562 | |||||||
| Calculation of Free Cash Flow: | |||||||||||||||
| Net cash flow from operating activities | $ | 46,081 | $ | 95,590 | $ | 248,985 | $ | 232,856 | |||||||
| Less: cash used in purchasing property and equipment | (36,926 | ) | (30,178 | ) | (111,879 | ) | (76,771 | ) | |||||||
| Free Cash Flow (8) | $ | 9,155 | $ | 65,412 | $ | 137,106 | $ | 156,085 | |||||||
See notes at the end of this earnings release.
Unaudited Performance Measures and Reconciliation of Non-GAAP Measures As of |
|||||||
| (in thousands, except per share amounts) | |||||||
| Reconciliation of Book Value to Tangible Book Value: | |||||||
| Book value (total shareholders' equity) | $ | 818,985 | $ | 617,588 | |||
| (454,900 | ) | (187,704 | ) | ||||
| Tangible Book Value (10) | $ | 364,085 | $ | 429,884 | |||
| Reconciliation of Book Value per Period End Share to Tangible Book Value per Period End Share: | |||||||
| Book value per period end share | $ | 52.12 | $ | 39.52 | |||
| (28.95 | ) | (12.01 | ) | ||||
| Tangible Book Value per Period End Share (11) | $ | 23.17 | $ | 27.51 | |||
| Calculation of Period End Shares: | |||||||
| Shares outstanding | 15,570 | 15,523 | |||||
| Plus: common equivalents | 142 | 103 | |||||
| Period End Shares (17) | 15,712 | 15,626 | |||||
| (in thousands) | |||||||||||
| Reconciliation of |
|||||||||||
| Book value (total shareholders' equity) | $ | 818,985 | $ | 617,588 | $ | 588,509 | |||||
| Plus: total funded debt | 215,770 | 71,976 | 93,186 | ||||||||
| Less: cash and cash equivalents | (26,010 | ) | (76,211 | ) | (7,569 | ) | |||||
| $ | 1,008,745 | $ | 613,353 | $ | 674,126 | ||||||
| $ | 811,049 | $ | 643,740 | ||||||||
See notes at the end of this earnings release.
| (1) | Last-twelve-months earnings per share is the sum of earnings per share reported in the last four quarters. |
| (2) | Last-twelve-months weighted average basic and diluted shares were determined by adding the weighted average shares reported for the last four quarters and dividing by four. |
| (3) | Funded debt includes outstanding borrowings under our revolving credit facility, term loan credit facility and our outstanding equipment notes. |
| (4) | These financial performance measures are provided as supplemental information to the financial statements. These measures are used by management to evaluate our past performance, our prospects for future performance and our ability to comply with certain material covenants as defined within our credit agreement, and to compare our results with those of our peers. In addition, we believe that certain of the measures, such as book value, tangible book value, free cash flow, asset turnover, return on equity, and debt leverage are measures that are monitored by sureties, lenders, lessors, suppliers and certain investors. Our calculation of each measure is described in the following notes; our calculation may not be the same as the calculations made by other companies. |
| (5) | EBITDA is defined as earnings before interest, taxes, depreciation and amortization. EBITDA is not recognized under GAAP and does not purport to be an alternative to net income as a measure of operating performance or to net cash flows provided by operating activities as a measure of liquidity. Certain material covenants contained within our credit agreement are based on EBITDA with certain additional adjustments, including our interest coverage ratio and leverage ratio, which we must comply with to avoid potential immediate repayment of amounts borrowed or additional fees to seek relief from our lenders. In addition, management considers EBITDA a useful measure because it provides |
| (6) | EBITDA per diluted share is calculated by dividing EBITDA by the weighted average number of diluted shares outstanding for the period. EBITDA per diluted share is not recognized under GAAP and does not purport to be an alternative to income per diluted share. |
| (7) | EBIA, net of taxes is defined as net income plus net interest plus amortization of intangible assets, less the tax impact of net interest and amortization of intangible assets. The tax impact of net interest and amortization of intangible assets is computed by multiplying net interest and amortization of intangible assets by the effective tax rate. Management uses EBIA, net of taxes, to measure our results exclusive of the impact of financing and amortization of intangible assets costs. |
| (8) | Free cash flow, which is defined as cash flow provided by operating activities minus cash flow used in purchasing property and equipment, is not recognized under GAAP and does not purport to be an alternative to net income, cash flow from operations or the change in cash on the balance sheet. Management views free cash flow as a measure of operational performance, liquidity and financial health. |
| (9) | Book value per period end share is calculated by dividing total shareholders’ equity at the end of the period by the period end shares outstanding. |
| (10) | Tangible book value is calculated by subtracting goodwill and intangible assets outstanding at the end of the period from shareholders’ equity. Tangible book value is not recognized under GAAP and does not purport to be an alternative to book value or shareholders’ equity. |
| (11) | Tangible book value per period end share is calculated by dividing tangible book value at the end of the period by the period end number of shares outstanding. Tangible book value per period end share is not recognized under GAAP and does not purport to be an alternative to income per diluted share. |
| (12) | The funded debt to equity ratio is calculated by dividing total funded debt at the end of the period by total shareholders’ equity at the end of the period. |
| (13) | Asset turnover is calculated by dividing the current period revenue by total assets at the beginning of the period. |
| (14) | Return on assets is calculated by dividing net income for the period by total assets at the beginning of the period. |
| (15) | Return on equity is calculated by dividing net income for the period by total shareholders’ equity at the beginning of the period. |
| (16) | Return on invested capital is calculated by dividing EBIA, net of taxes, less any dividends, by average invested capital. Return on invested capital is not recognized under GAAP, and is a key metric used by management to determine our executive compensation. |
| (17) | Period end shares is calculated by adding average common stock equivalents for the quarter to the period end balance of common stock outstanding. Period end shares is not recognized under GAAP and does not purport to be an alternative to diluted shares. Management views period end shares as a better measure of shares outstanding as of the end of the period. |
| (18) | Average invested capital is calculated by adding net funded debt (total funded debt less cash and marketable securities) to total shareholders’ equity and calculating the average of the beginning and ending of each period. |


Source: MYR Group, Inc.